AI detection engine
Prometheus alert rules trigger within seconds of an anomaly. Metrics, logs and context enter one response path instead of six separate tools.
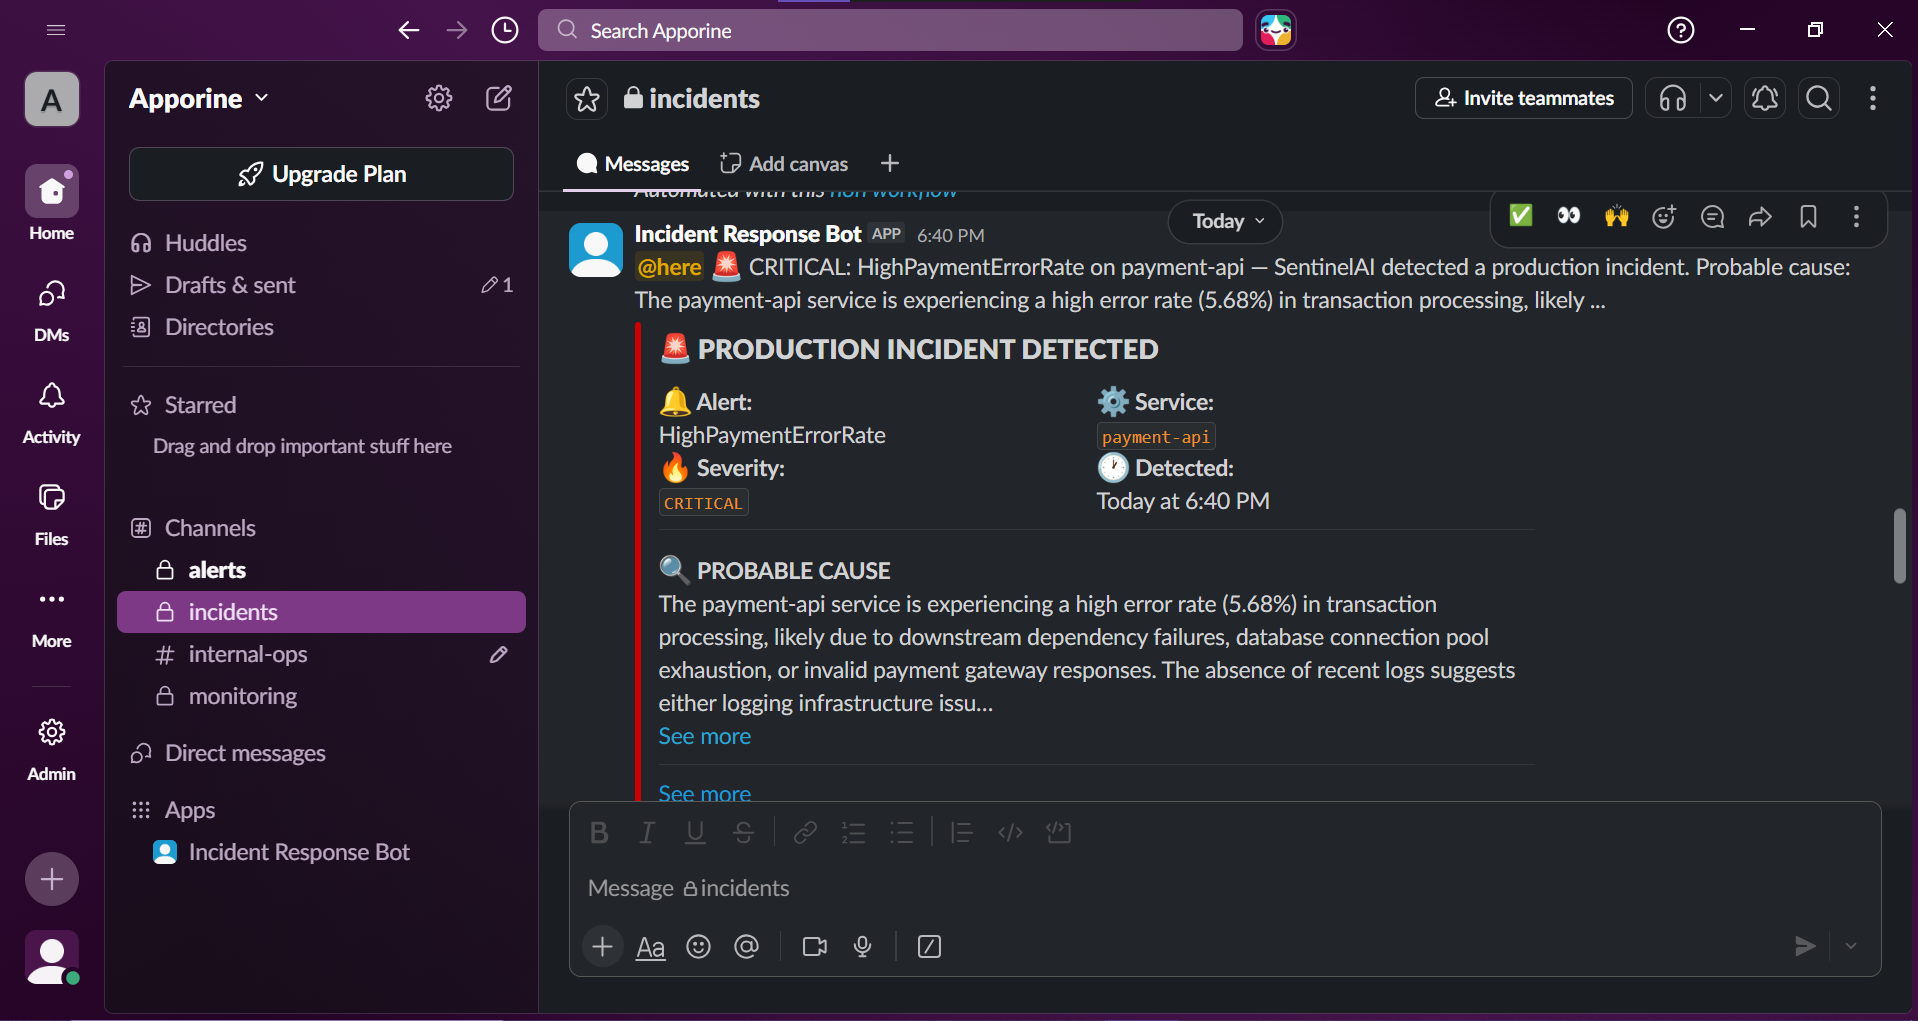
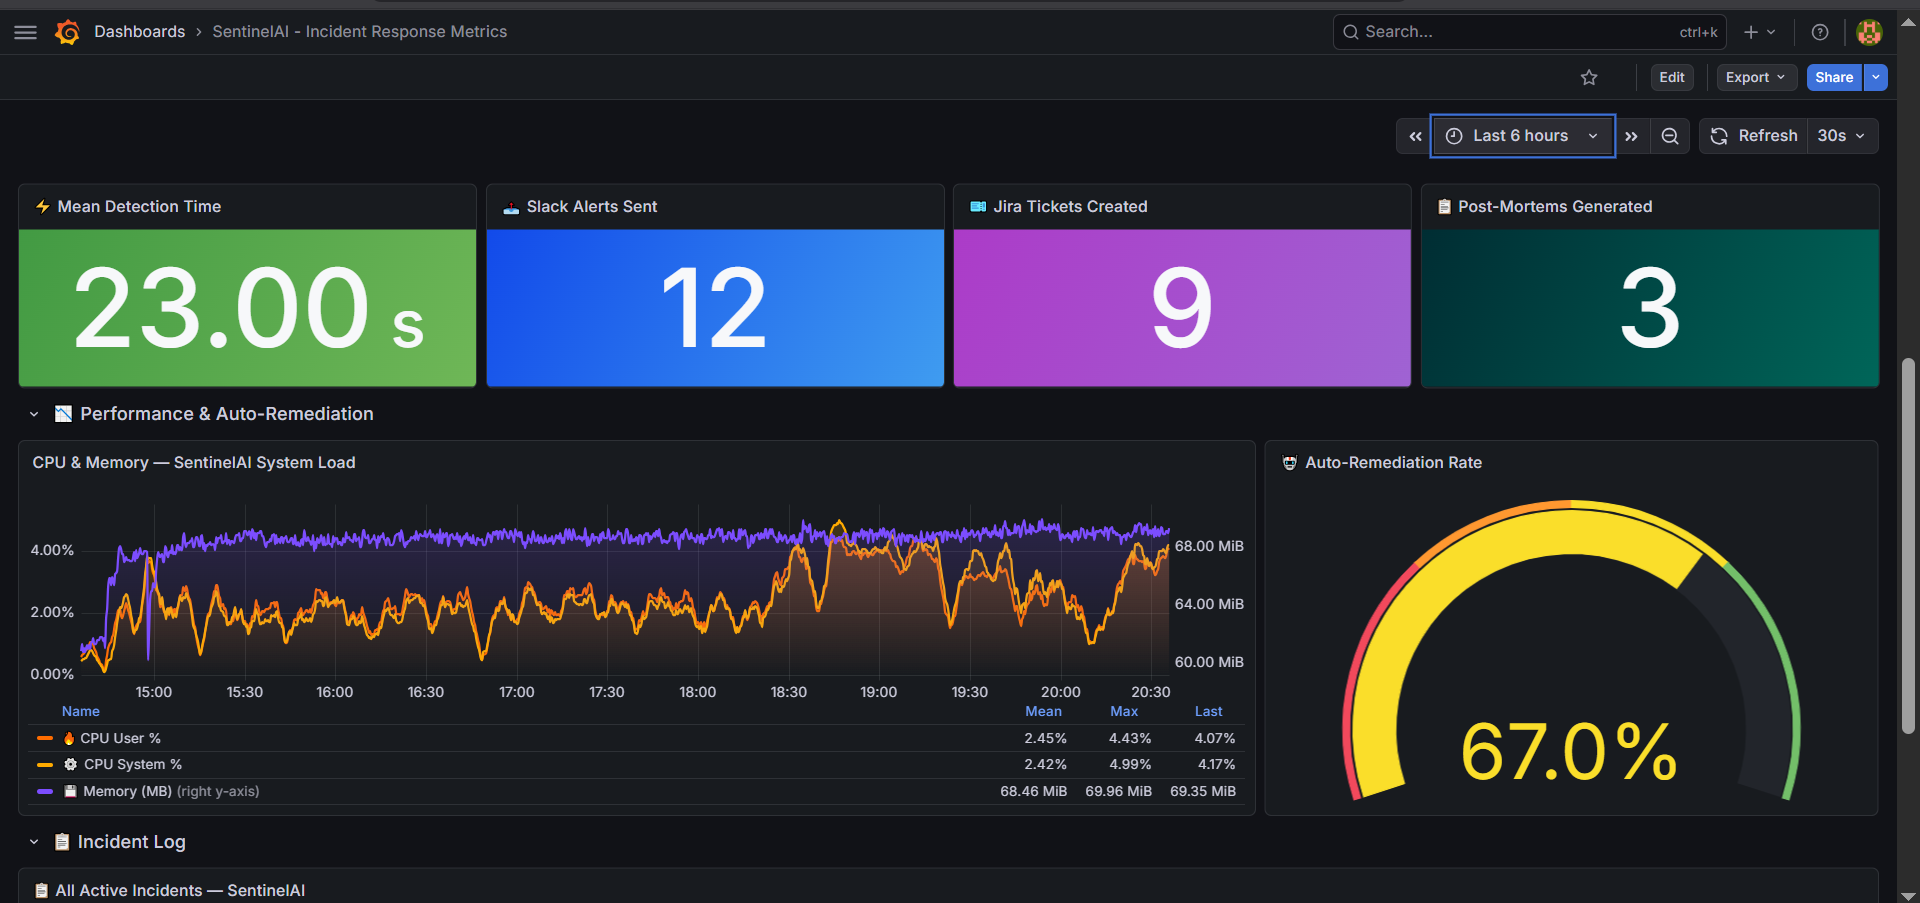
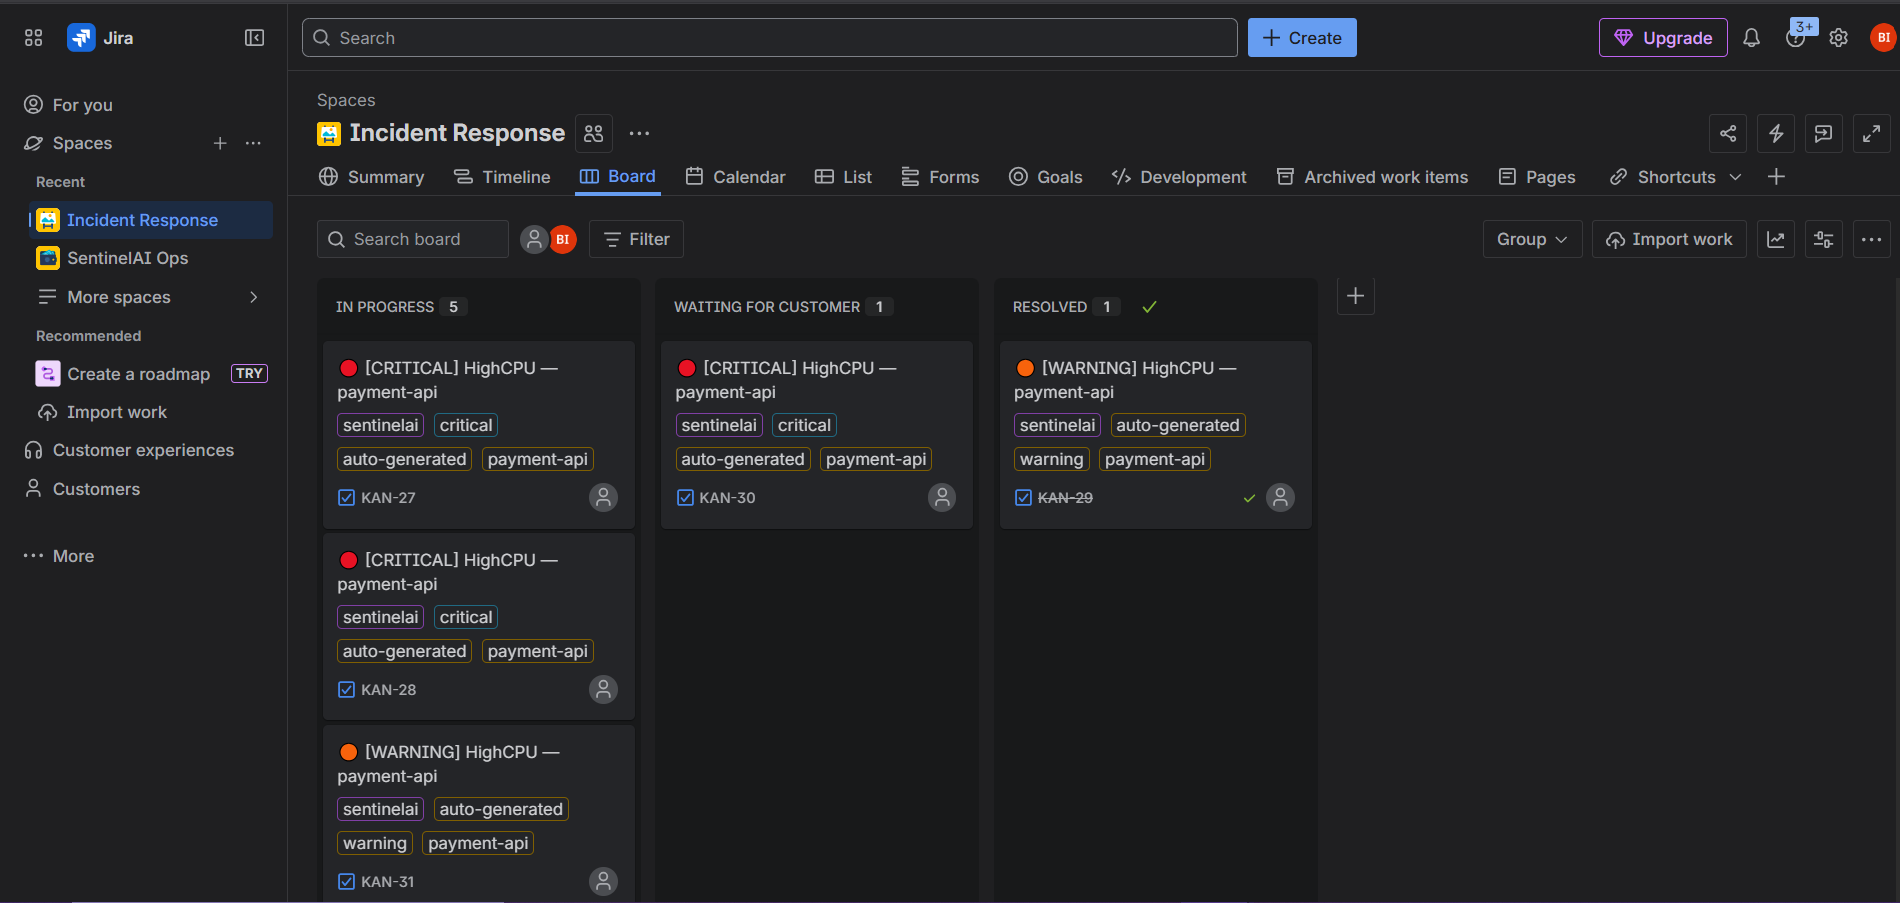
The screenshots below show the incident-response workflow, monitoring and operational outputs used by the system.
The operational cost was not only downtime. Engineers were losing sleep, context was scattered across tools, and each incident depended on whoever happened to be online.
The system was built as a sequence of explicit responsibilities rather than one oversized “AI bot.” Each stage has a clear input, output and owner.
Prometheus alert rules trigger within seconds of an anomaly. Metrics, logs and context enter one response path instead of six separate tools.
Claude AI turns raw incident context into probable cause, confidence level, immediate action steps and escalation recommendations.
Unacknowledged incidents move through a timed escalation path so reminders and leadership escalation are explicit and logged.
Eligible incidents can be remediated automatically while Jira, runbooks and reporting retain a complete history of what happened.
“Before SentinelAI, our on-call rotation was a nightmare. Engineers were getting paged at 3 AM for things that weren’t even real incidents. Since deployment, 67% of alerts resolve themselves before anyone wakes up. The AI diagnosis messages in Slack are so detailed that even our junior developers know exactly what to do. Bisma didn’t just build us a bot, she gave our team their nights back.”
Share the symptoms, current stack and operational stakes. I’ll tell you what I would investigate first.
No pitch deck required. Start with what is breaking, what changed, and what is at risk.
Send project context ↗